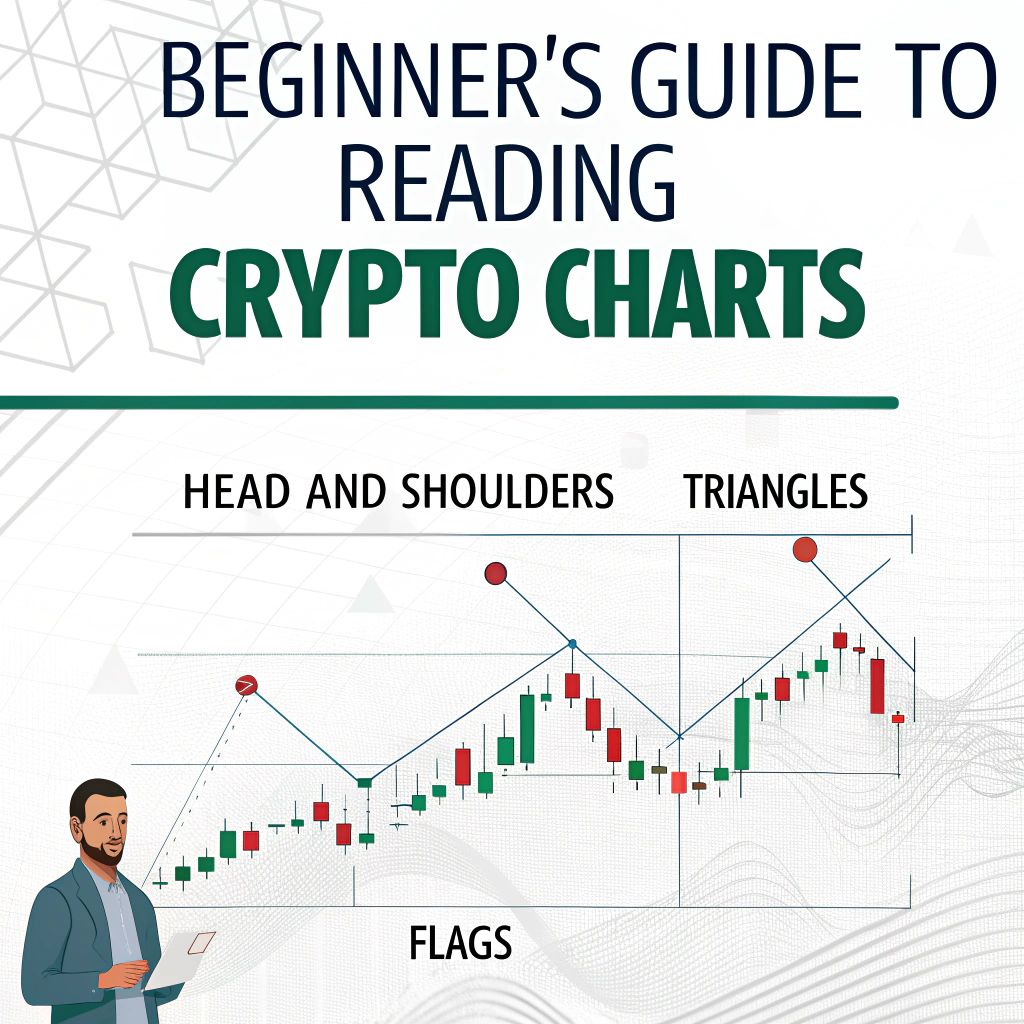
How to Read Crypto Charts: A Beginner’s Guide to Chart Patterns
Introduction
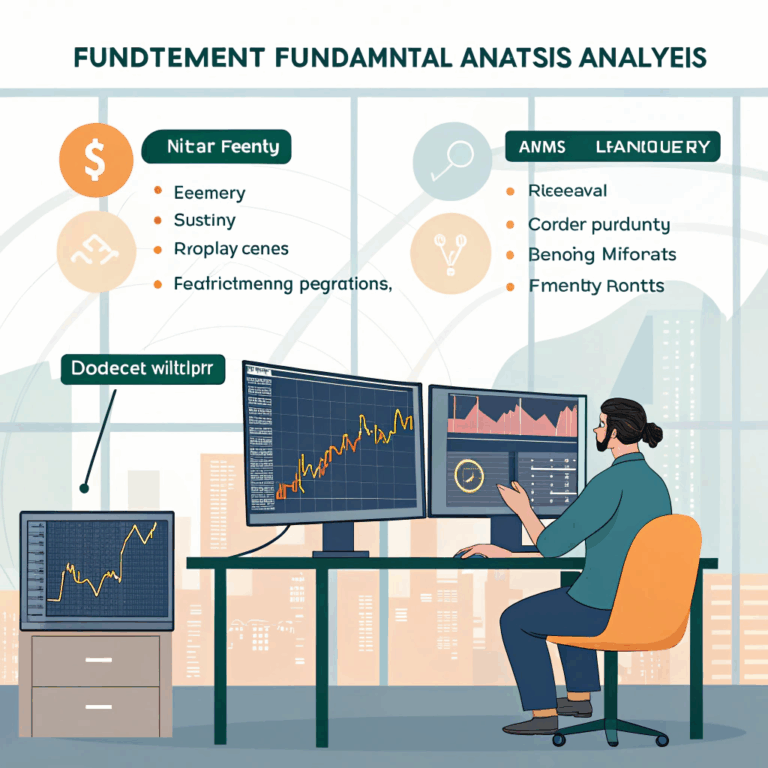
As a crypto trader, being able to read crypto charts effectively is essential. Charts provide crucial insights into market trends, entry and exit points, and potential price movements. In this guide, we’ll explore how to interpret crypto charts and the most important chart patterns every trader should know.
Understanding Time Frames
The time frame you choose to view a chart will affect your analysis. Shorter time frames (e.g., 1-minute, 5-minute charts) are often used for day trading, while longer time frames (e.g., 4-hour, daily charts) are better for swing trading and long-term investments. Understanding which time frame suits your trading style is essential for making informed decisions.
Bullish and Bearish Patterns
- Bullish Patterns: Indicate price increases. Examples include Double Bottom and Cup and Handle.
- Bearish Patterns: Indicate price declines. Examples include Head and Shoulders and Descending Triangle.
By recognizing these patterns, traders can anticipate potential trend reversals and price movements.
Support and Resistance Levels
Support and resistance levels are key to understanding market behavior. These levels show where prices have historically reversed. Identifying these areas can help traders make better decisions regarding entry and exit points.
Trend Lines
Trend lines are used to identify the direction of the market. An upward trend line connects higher lows, and a downward trend line connects lower highs. Trend lines help traders determine the prevailing market direction and align their trades accordingly.